Graduate Employment Outcomes
Overview
This chart includes an overview of the employment data for the 2019-2023 graduating classes. You will also find more detailed employment data in the sections below. To view the official ABA reports for the past 3 graduating classes, click the following links.
Class of 2023 Official ABA Graduate Report
Class of 2022 Official ABA Graduate Report
Class of 2021 Official ABA Graduate Report
| JD 2023 | JD 2022 | JD 2021 | JD 2020 | JD 2019 | |
|---|---|---|---|---|---|
| Total Graduates | 183 | 189 | 184 | 182 | 182 |
| Employed | 178 | 183 | 178 | 175 | 178 |
| Bar Passage Required | 166 | 168 | 164 | 167 | 167 |
| JD Advantage | 9 | 10 | 12 | 8 | 9 |
| Professional Position | 3 | 5 | 2 | 0 | 2 |
| Non-Professional | 0 | 0 | 0 | 0 | 0 |
| Undeterminable | 0 | 0 | 0 | 0 | 0 |
| Pursuing Graduate Degree | 1 | 5 | 5 | 1 | 2 |
| Unemployed: Not seeking | 1 | 0 | 0 | 1 | 1 |
| Unemployed: Seeking | 0 | 1 | 1 | 3 | 1 |
| Unemployed: Start Date Deferred | 2 | 0 | 0 | 0 | 1 |
| Employment Status Unknown | 1 | 0 | 1 | 0 | 0 |
The Details
Employer Type
Employment status is collected for 100% of graduating classes; 9 months after graduation.
| JD 2023 | JD 2022 | JD 2021 | JD 2020 | JD 2019 | |
|---|---|---|---|---|---|
| Law Firm Overall | 53.01% | 47.55% | 52.4% | 42.14% | 54.29% |
| Size: 500+ | 45.90% | 37.70% | 34.83% | 42.29% | 41.21% |
| Size: 251-500 | 2.19% | 0.55% | 7% | 1.69% | 4.95% |
| Size: 1-250 | 4.92% | 9.30% | 5.62% | 6.85% | 3.30% |
| Size: Unknown | 0% | 0 | 0 | 0 | 0 |
| Judicial Clerkships | 24.04% | 27.87% | 32.58% | 27.43% | 30.77% |
| Public Interest | 13.10% | 14.75% | 14.05% | 12% | 8.24% |
| Government | 3.83% | 4.37% | 6.74% | 1.71% | 3.85% |
| Business | 2.73% | 5.46% | 3.93% | 4.57% | 4.95% |
| Academia | 0.55% | 0% | 0.50% | 0.56 | 0.55% |
| Graduate School | 0.55% | 2.65% | 2.03% | 2.72% | 0.55% |
| Start Date Deferred | 1.09% | 0 | 0.5% | 0% | 0% |
| Unemployed: Seeking | 0.55% | 1.52% | 0.54% | 1.65% | 0.55% |
| Unemployed: Not Seeking | 0% | 0.53% | 0.55% | 0.55% | 0% |
| Unknown | 0.55% | 0 | 0 | 0.55% | 0 |
Clerkship Specific
Clerkship status is collected for each class at 9 months after graduation.
| JD 2023 | JD 2022 | JD 2021 | JD 2020 | JD 2019 | |
|---|---|---|---|---|---|
| Graduates reporting a clerkship as a first job | 24% | 27% | 31% | 27% | 31% |
| Graduates reporting a clerkship starting at any time | 37% | 40% | 44% | 43% | 40% |
| Clerks reporting multiple clerkships | 32% | 22% | 36% | 31% | 40% |
Region
Number of students per region; information collected for all employed graduates.
| JD 2023 | JD 2022 | JD 2021 | JD 2020 | JD 2019 | |
|---|---|---|---|---|---|
| SF & Other Bay Area | 51 | 62 | 47 | 48 | 50 |
| LA & Other Southern CA | 28 | 24 | 14 | 15 | 23 |
| Other West (AZ, NM, UT,CO, WY, ID, AK, HI, NV, WA, OR, MT) |
14 | 12 | 15 | 17 | 20 |
| NY & Other Northeast (ME, NH, VT, MA, CT, RI) |
35 | 30 | 36 | 28 | 28 |
| DC & Other Mid-Atlantic (NJ, DE, PA, MD, VA) |
24 | 29 | 36 | 35 | 31 |
| Chicago & Other Midwest (OH, IN, IL, MO, KS, NE, IA, ND, SD, MI, MN, WI) |
11 | 11 | 13 | 12 | 11 |
| Southeast (WV, NC, SC, GA, FL, TN, KY, AR, AL, MS, LA, TX, OK, PR) |
15 | 14 | 15 | 19 | 15 |
| International | 0 | 1 | 2 | 1 | 0 |
Salary
The chart below shows the salary range, median salaries and total number of graduates reporting salary for the last five graduating classes. To protect student privacy, salary information is not reported where fewer than 5 students reported their salary.
| Class Year | Law Firms | Clerkships | Public Interest | Government | Business |
|---|---|---|---|---|---|
| JD 2023 | $112k – $250k $225k 95/97 |
$62,172 – $85,508 $76,990 39/44 |
$48k – $90k $48k 16/24 |
<5, <5, 4/7 |
<5, <5, 1/5 |
| JD 2022 | $75k – $215k $215k 82/87 |
$66,214– $88,318 $72,340 51/51/td> |
$48k – $120k $60,000 19/27 |
$60k – $130k $83k 7/8 |
$190k – $500k $260k 7/10 |
| JD 2021 | $95k – $215k $215k 74/74 |
$55,756 – $78,861 $71,697 58/58 |
$54k – $84,348 $60,000 22/25 |
$67,000 – $121,000 $67,224 7/12 |
<5, <5, 2/7 |
| JD 2020 | $70k – $200k $190k 93/95 |
$64,009 – $78,081 $70,987 49/49 |
$45k – $67k $51k 16/22 |
<5, <5, 2/3 |
<5, <5, 2/8 |
| JD 2019 | $95k – $215k $190k 86/90 |
$61,218 – $73,905 $66,110 55/56 |
$45k – $63500 $50,000 11/16 |
<5, <5, 4/7 |
$100,00 – $205,000 $130,000 5/8 |
Miscellaneous
JD Advantage Positions
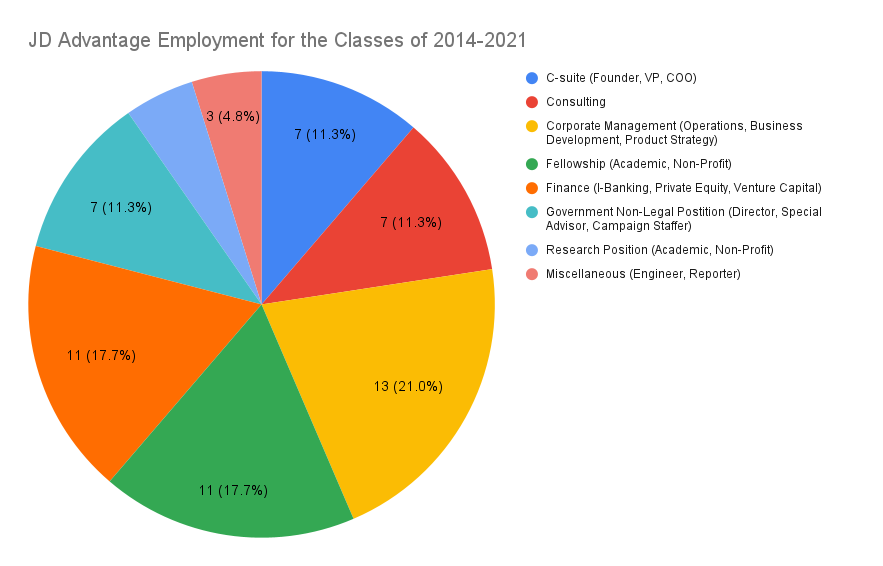
See below for information on the jobs classified as JD Advantage for the class of 2014 – 2021
Professional Other PositionsSee below for information on the jobs classified as professional other for the class of 2014 – 2021

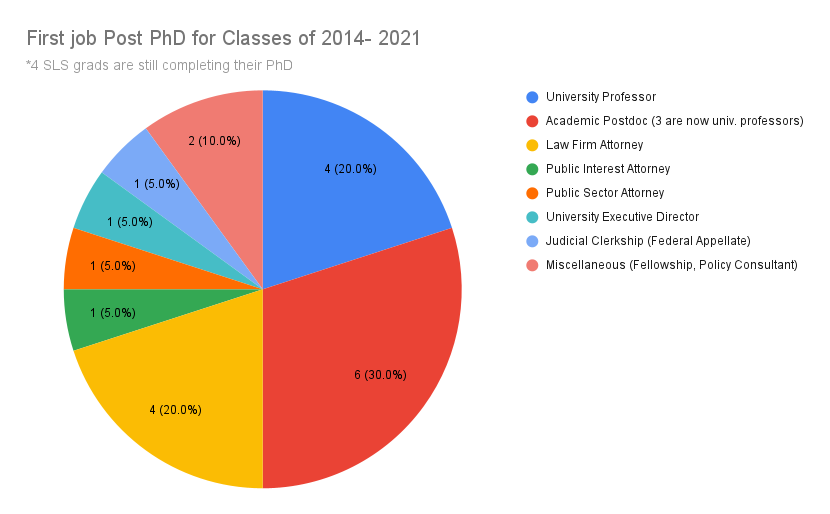
Post PhD PositionsSee below for information on the first post-PhD positions for SLS joint degree PhD students for the class of 2014 – 2021
| C-suite | Consulting | Corporate Management | Fellowship | Finance | Government Non-legal Position | Research Position | Miscellaneous | |
|---|---|---|---|---|---|---|---|---|
| Number of Positions | 7 | 7 | 13 | 11 | 11 | 7 | 3 | 3 |
| Position Examples | Founder, VP, COO | Consultant | Operations, Business Development, Product Strategy | Academic Fellow, Non-Profit Fellow | I-Banking, Private Equity, Venture Capital | Director, Special Advisor, Campaign Staffer | Academic Researcher, Non-Profit Researcher | Engineer, Reporter |
| Business Development | C-Suite | Consulting | Corporate Management | Finance | Misc. | |||
| Number of Positions | 2 | 3 | 1 | 7 | 4 | 5 | ||
| Position Examples | Business Development | CEO, Head of Enterprise, VP of Finance | Consultant | Marketing, Strategy, Product Development, Operations, Engagement | Investment Banking, Venture Capital, Research Analyst | Researcher, Data Scientist, Developer, Military, Actuary | ||
| University Professor | Academic Postdoc | Law Firm Attorney | Public Interest Attorney | Public Sector Attorney | University Executive Director | Judicial Clerkship (Federal Appellate) | Miscellaneous | |
| Number of Positions | 4 | 6 | 4 | 1 | 1 | 1 | 1 | 2 |
| Position Examples | Professor | Academic Fellow (3 are now univ. professors) | Associate Attorney | Senior Attorney | Special Counsel | Executive Director | Law Clerk | Consultant, Legal Fellow |